
WEBFLEET Reporting
You can only manage what you measure. Fortunately, you can measure a lot with WEBFLEET. Based on customer feedback, WEBFLEET know what kind of information is important. The reports produced help you to keep on top of everything from fuel efficiency to legal compliancy to quality of service. Find a selection of the most popular fleet management reports in use by WEBFLEETS customers below.
Vehicle Tracking Reporting
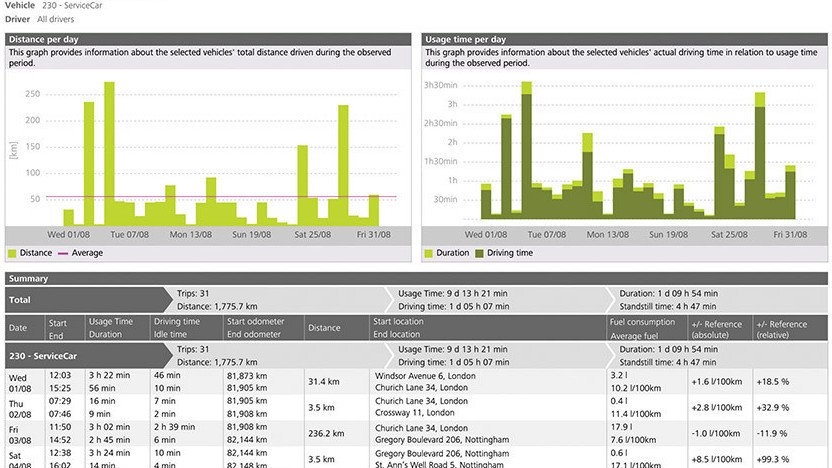
Trip Report (Daily Summary)
Get a quick and clear overview of when, how long and how often your vehicles are used.
• Graph showing the distances driven per day and the fleet's average.
• Graph comparing the driving time per day with the total time your vehicles are used.
• A comprehensive summary of the number of trips, mileages, usage and duration, including driving and standstill times.
• Overview of mileage, distance, duration, and start and end locations.
• Fuel consumption details (if supported, optional).
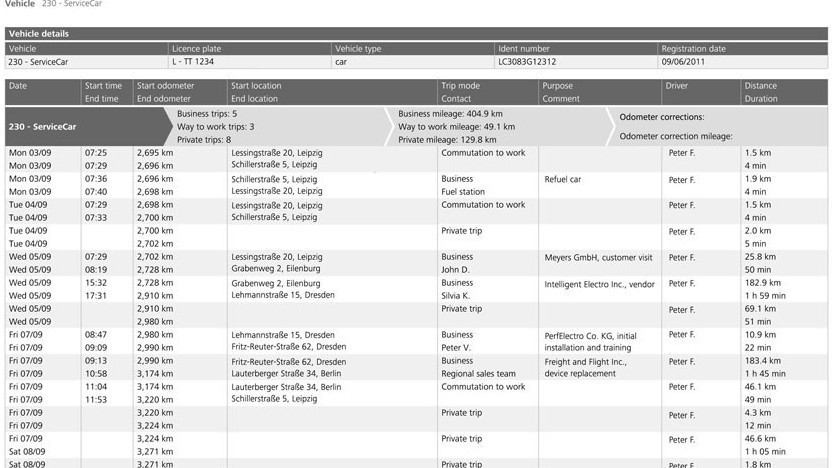
Trip Report (Logbook)
Have reliable automatic logbooks for your drivers that comply with legal requirements.
• Summary for the selected vehicle for the defined period.
• Overview of single trips including all trip details.
• Business vs. private trips as a percentage to help you quickly decide whether your logbook is helpful for tax purposes.
• Detailed history of changes to the logbook.
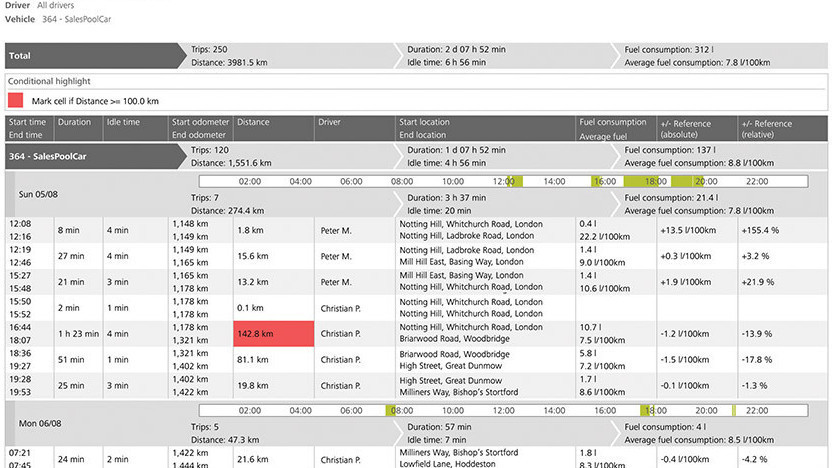
Trip Report (Detailed)
Easily see how efficient your vehicles are when out on the road.
• A trip summary for all vehicles within the selected period.
• A summary per vehicle per day.
• A timeline graph showing vehicle trips per day.
• The option to highlight addresses in the report when they appear as the start and/or end location.
• The option to highlight trip fuel consumption when it exceeds a defined fuel threshold.
Workforce Management Reporting
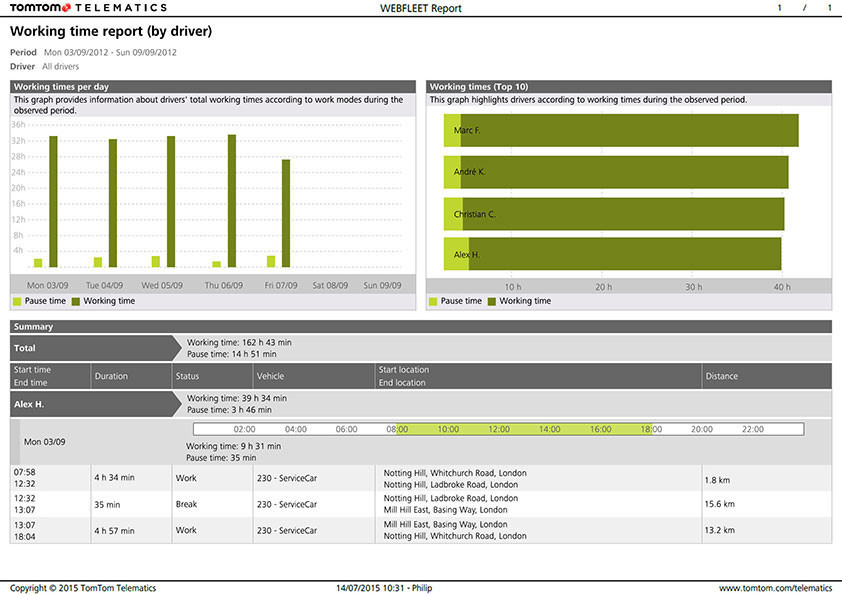
Working Time Report (by driver)
Stay informed about the hours worked by your staff.
• Driver's performance shown in a graphical overview.
• A clear chart displaying the development of your driver in terms of their OptiDrive 360 variables over time.
• Comprehensive summaries showing distance, driving time and fuel consumption information together with OptiDrive 360 indicator information.
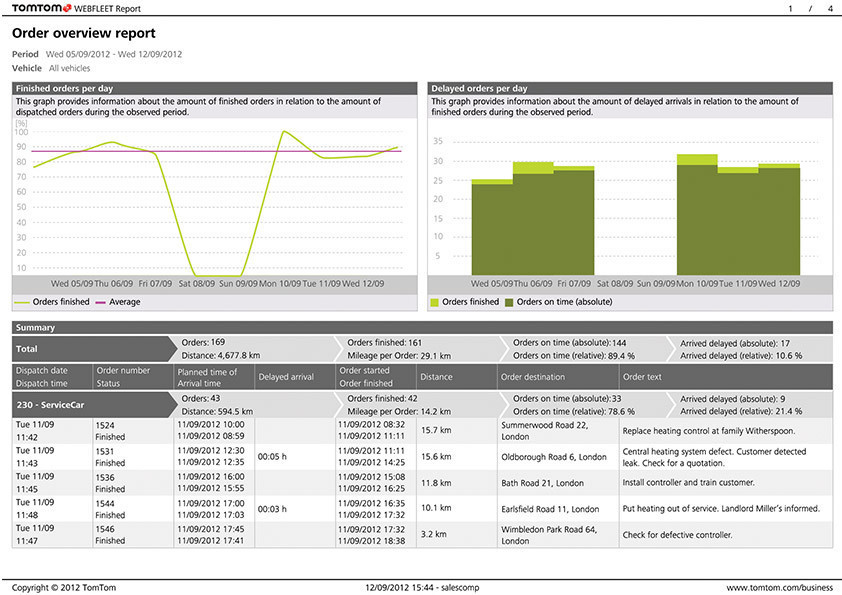
Order Overview Report
See how order productivity is developing for your fleet.
• Visual graph showing the fleet's average of finished orders per day and the daily result as a percentage.
• Visual graph comparing the number of delayed orders with finished orders per day.
• Comprehensive summary of all vehicles' order performance including the number of orders, distances to drive and arrivals - on time or delayed.
• You can define a threshold after which an order is considered to be delayed.
• The delayed arrival at the order location can be highlighted in the overview.
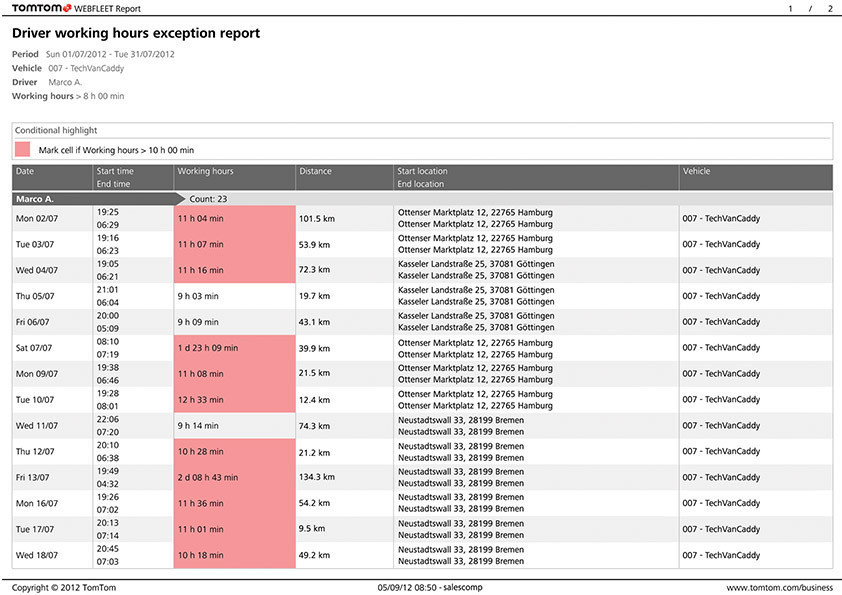
Driver Working Hours Exception Report
Quickly see where working hours are being exceeded.
• Working hours that exceed a chosen limit are shown in the overview. You can choose from >4 hours, >6 hours, >8 hours, >10 hours, >12 hours, >16 hours, >20 hours.
• You can set an additional threshold that is used to highlight excessive working hours in the overview.
Green & Safe Reporting
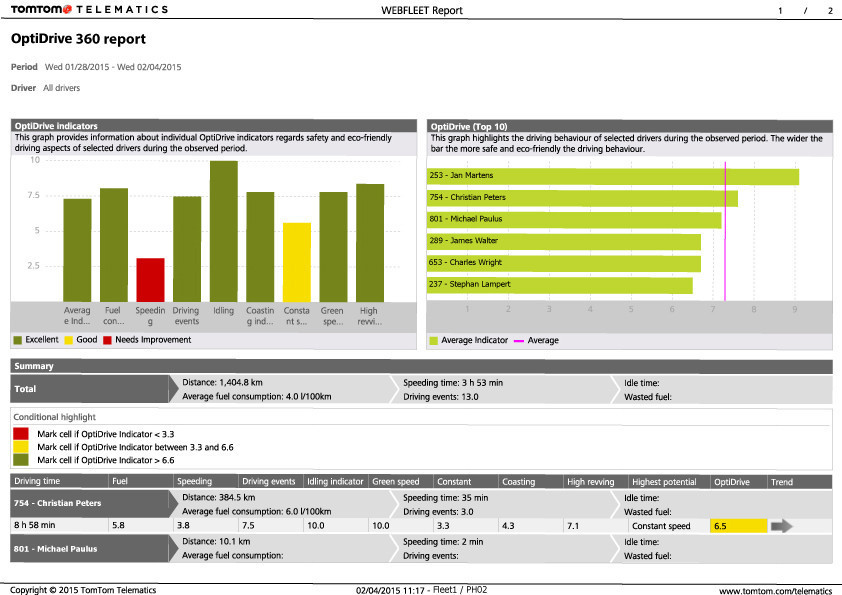
OptiDrive 360 Report
Clearly see your drivers' performance on safe and environmentally responsible driving.
• Driver's performance shown in a graphical overview.
• A clear chart displaying the development of your driver in terms of their OptiDrive 360 variables over time.
• Comprehensive summaries showing distance, driving time and fuel consumption information together with OptiDrive 360 indicator information.
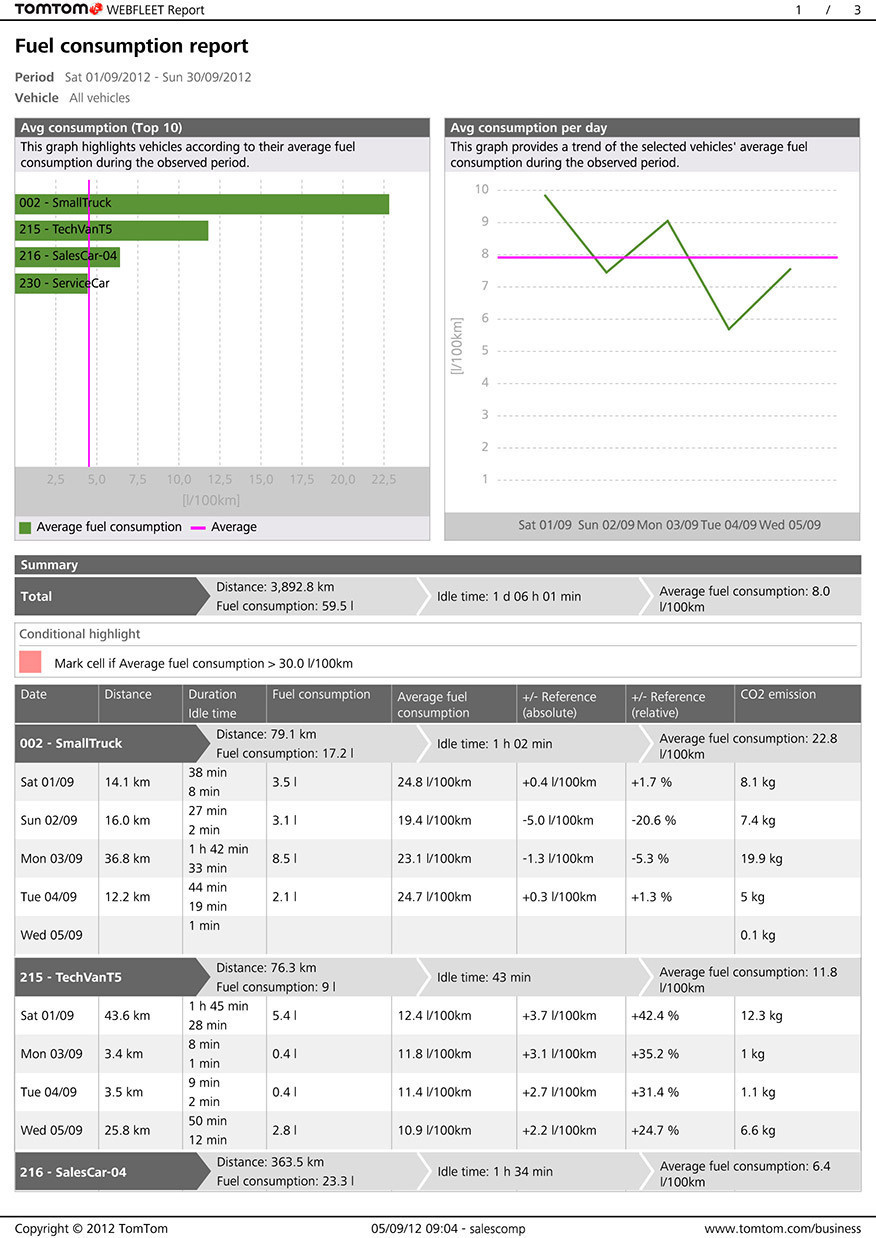
Fuel Consumption Report
Monitor the fuel consumption of your fleet's vehicles and easily see exceptional events.
• Visual graphs showing the fuel consumption and the fleet's average, and how fuel consumption evolves over time across the fleet.
• Highlights fuel consumption when it exceeds a definable maximum threshold.
• Fuel consumption is shown per trip in total and per 100 km.
• Fuel consumption is measured against the reference value in l/100km and in percent.
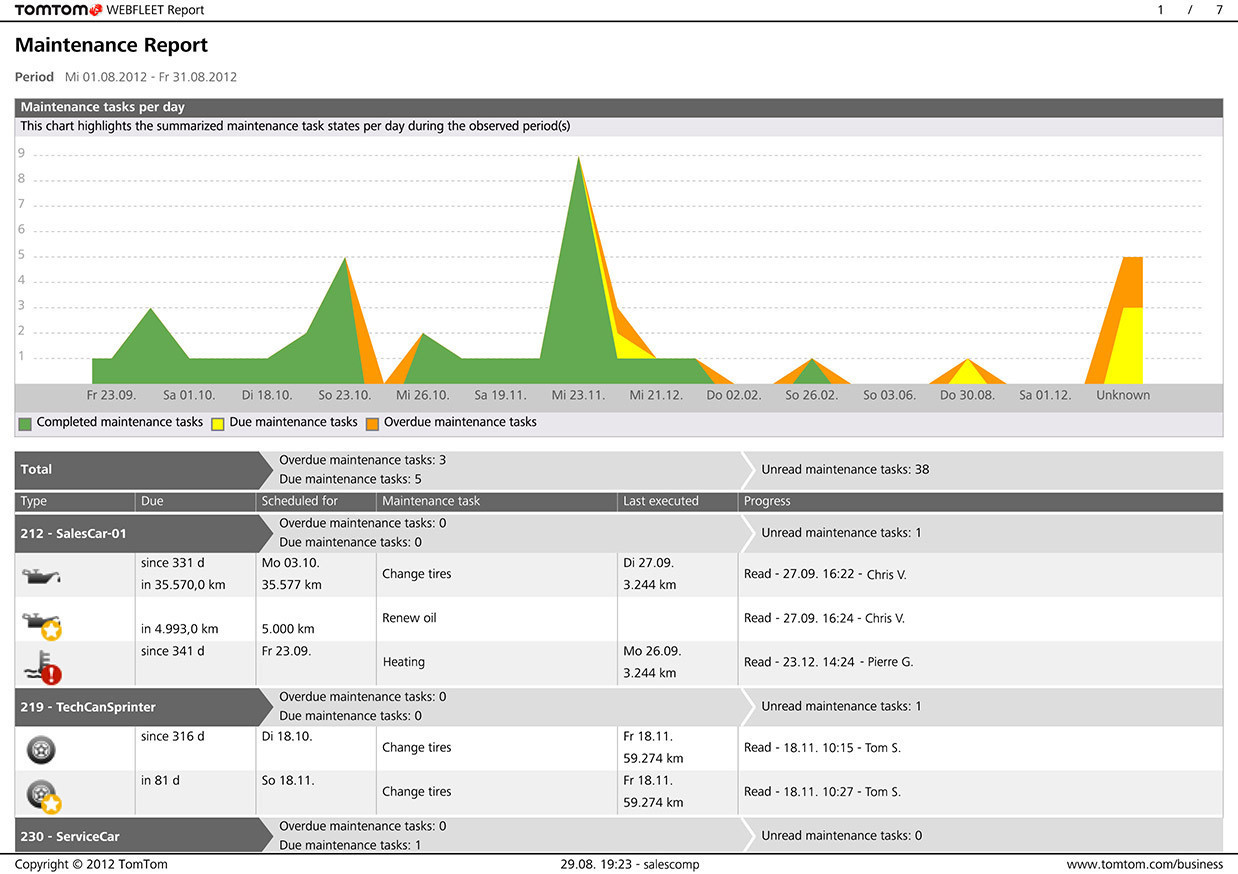
Maintenance Report
Be alerted when your vehicles are due further maintenance work.
• Visual chart comparing the number of overdue, due and completed maintenance tasks over the selected period.
• Maintenance task summaries for all vehicles and for individual vehicles.
• Overview per vehicle showing the time or mileage to/after due date, the scheduled date, the name of the maintenance task, when the task was carried out last, and the current state of progress on that task.
For a full quote and demonstration, please call us now (0141-353-9595) or please complete the contact details on the contact us page.